CANA’s Cremation Statistics Teach Us About Success in an Ash-Facing Future
The funeral industry tenses up every year around this time when CANA publishes their Cremation Statistics Annual Report – fearing the inevitable cremation rate increase. We are at a point now where there is no doubt about the continued popularization of cremation. It was chosen in over 50% of deaths for the first time ever in 2016 and the report is now helping us redesign our funeral home business models for this definite shift. The 2017 report is helping us answer the question:
How do I shape my business for a cremation-facing future?
First, we want to understand the latest cremation cremation statistics in the 2017 report. Download the full 2017 CANA report here for a limited time.
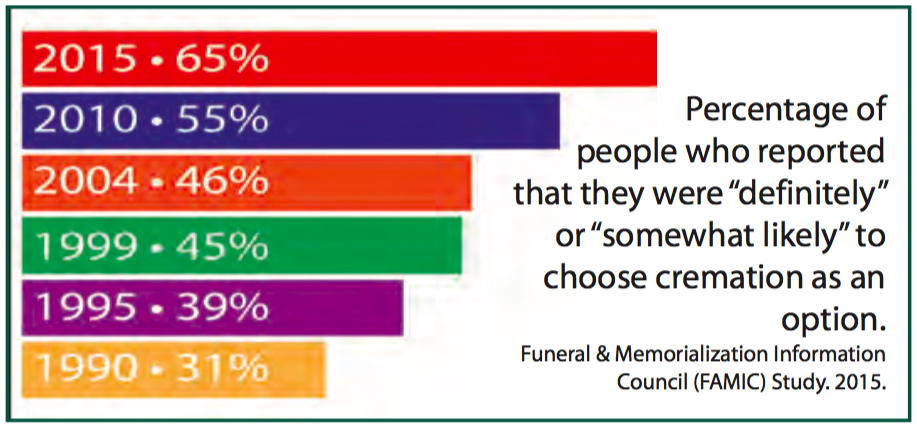
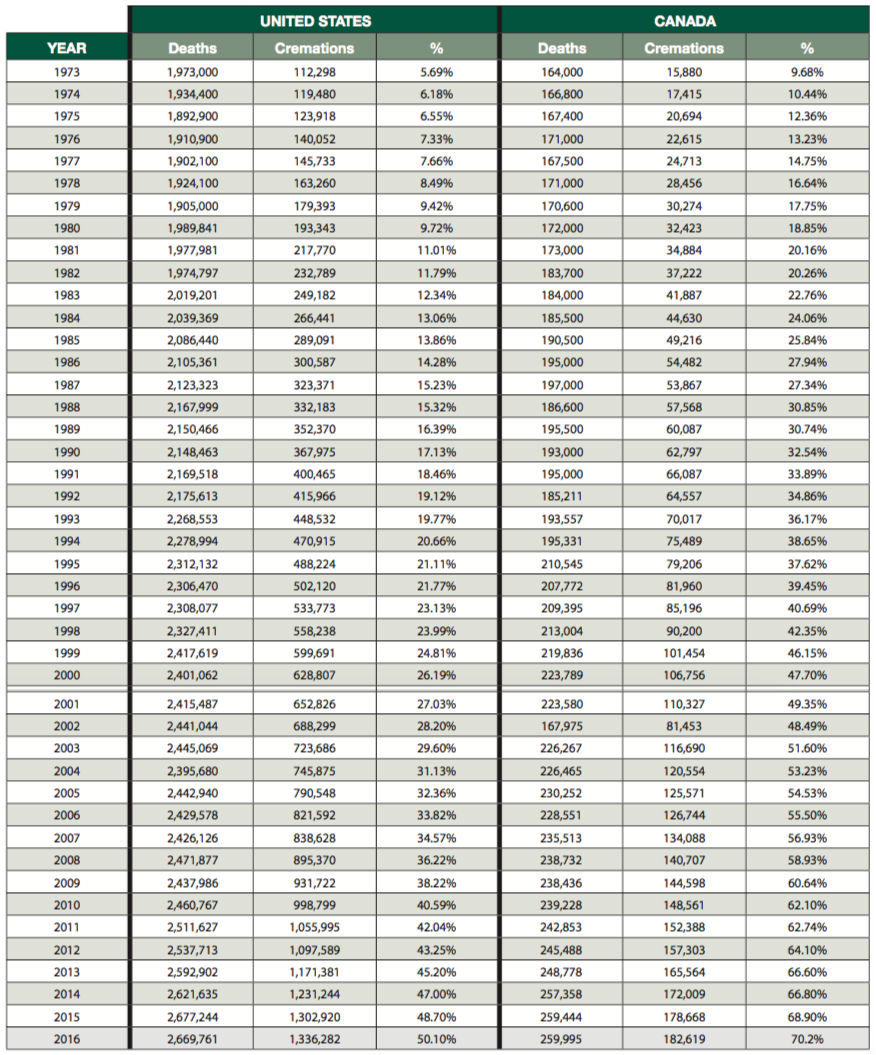
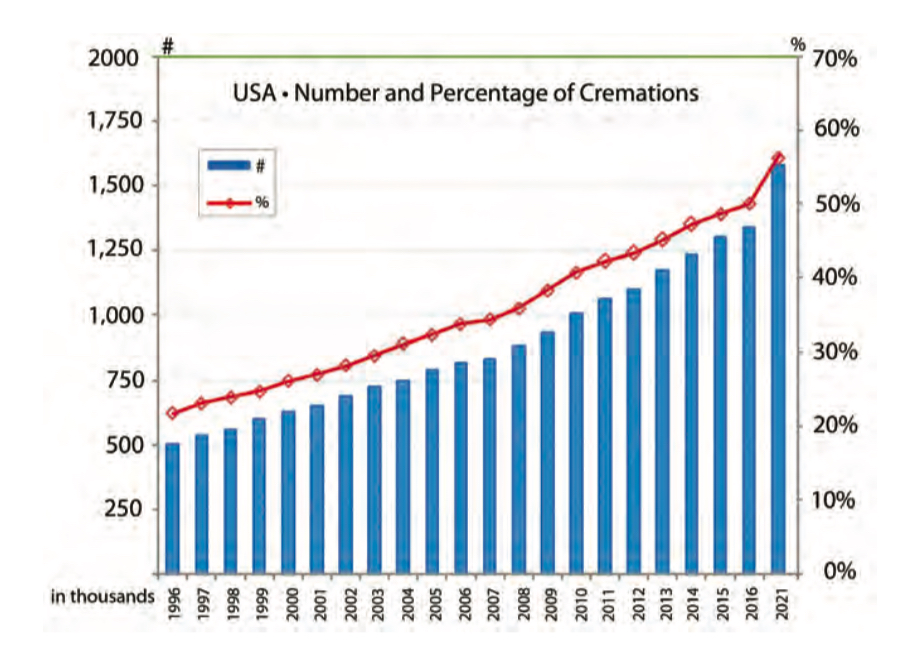
The Cremation Association of North America has been collecting data since 1913 and is the leading source for U.S. cremation statistics reporting. According this year’s report, the cremation rate has risen 25% in the past two decades up to 50% in 2016. Based on these results, CANA predicts a continued rise to about 56% by 2021. If we are on the same track as the UK, the cremation rate will continue to grow to their current rate of 76% or higher and we need to adopt new business models to succeed in that industry climate.
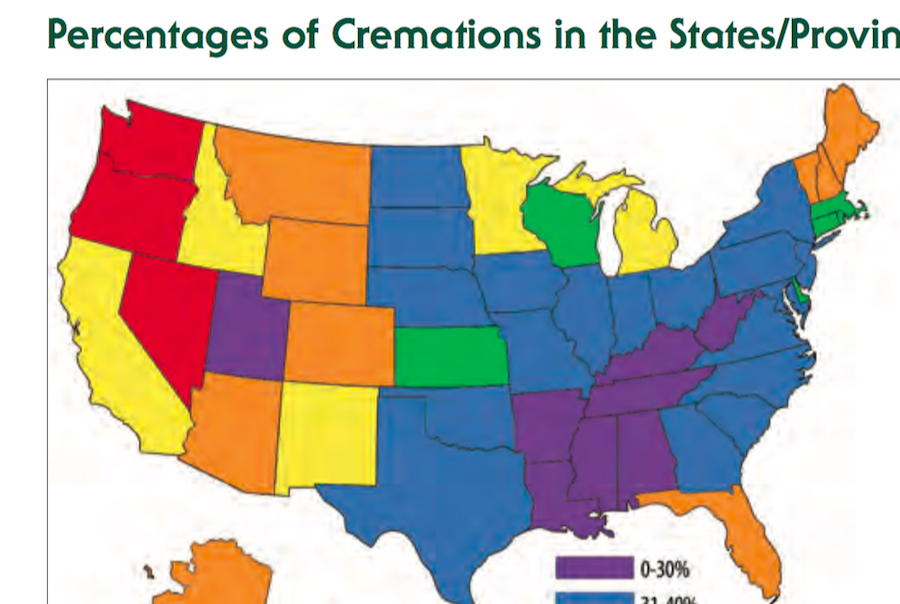
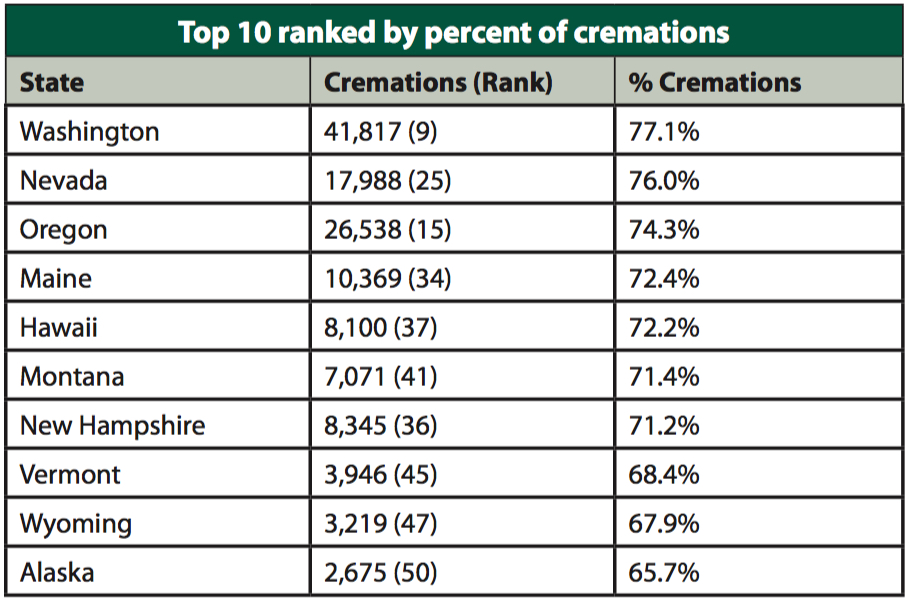
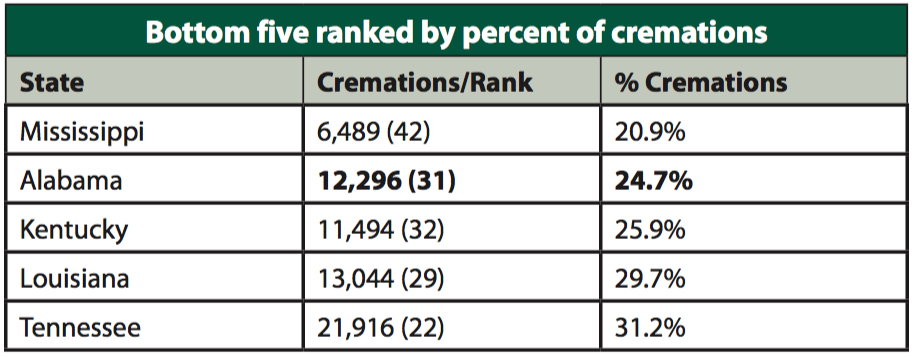
The U.S. is much more complex than the UK, though, with massive variation in cremation rate from region-to-region spanning from Washington, on the high end, at 77.1% to Mississippi, on the low end, at 20.9%.
These vast regional differences in cremation rate have created divergent business models in funeral homes across the United Sates. It is essential that funeral homes know the cremation rate in their region and how quickly it’s growing. To check the cremation statistics in your region download CANA’s detailed report here.
When analyzing your target customers, it is important to understand the proclivities your individual community. Exciting new research from CANA described in this blog post identifies trends for communities embracing cremation versus those adopting it slowly. The report states:
Communities that embrace cremation early and often have:
• high concentration of small businesses and businesses owned by women
• less religious affiliation or affiliation with religions other than Christianity
• higher incomes
• lower home ownership but higher home values
• higher education levels achieved on average
• more immigrants and populations that speak a language other than English in the home.
Communities that embrace cremation at a slower rate have:
• higher concentration of manufacturing businesses and output
• high affiliation with Christianity
• higher home ownership rates but lower home values
• lower education rates achieved on average
How do I shape my business for a cremation-facing deathcare future?
It has been a tough two decades for many funeral homes for one simple reason: The burial and service business model that has worked for the past 100 years stopped working. It is possible to succeed in the new environment, but changing your business to fit the new customer desires is essential. The CANA cremation statistics report explains,
The key to success means moving beyond a business model that is based on the mode of disposition and transitioning to a model based on service to families. The challenge remains in understanding the different motivations driving cremation growth.
“The good news here—the BIG takeaway—is that we’re entering a period of great stability as far as business planning,” explains Bob Boetticher, Jr. of the CANA Statistics Committee in his recent blog post. “If you know which segments of the community you currently reach, you can hone your message even further. You can also find ways to increase your market share when you identify new segments to target.”
See how your business compares to your state and regional cremation rates the stats in your state by downloading the 2018 report from CANA here. It’s only available to non-members of CANA for a limited time!
Historical Cremation Data